How To Utilize The Power of Shopify Analytics?
You have set up your Shopify store, promoted your business on social media channels, and invested in SEO. You might have seen the increase in the website traffic, but all these clicks and new visitors haven’t really matched your KPI goals. And now you wonder — why? Let us tell you the reason.
Consistent success and growth only happen when there are trends, processes, and concrete numbers that you navigate with. All this can be easily processed and managed through a reliable analytical tool. Fortunately, the answers to an analytical tool are Shopify reports and statistics.
Now, you might be thinking that “Does Shopify offer analytics?” So let us just inform you that Shopify Analytics enables you to perform deep research into the historical business data, facts, figures, and future forecasting so that it would be easy for you to make the most intelligent decisions for your business.
What is Shopify Analytics?
Shopify Analytics is an essential data-driven tool designed to help eCommerce store owners efficiently grow with valuable business insights. Discover what reports are available and how you can use them to scale your online business. Understating Shopify Analytics reports & data not only helps you to optimize your eCommerce store, but will also help you make better decisions or the direction you need to take.
In this blog, let’s find out what’s included in Shopify analytics, and what can you do with Shopify Analytics?
How To Analyze Shopify Analytics?
The three main reporting views of Shopify Analytics that you can access from your store dashboard:
- Dashboards: Offers all the key metrics at a glance and a basic understanding of how your online store is performing. This section takes you to the Overview dashboard, where you can view the metrics for a different time range using the date filter on top.
- Reports: This section helps you understand and view the metrics in detail, which are presented in the Overview dashboard. Deep Dive into each of the reports by analyzing the report’s topic wise i.e. Sales, Acquisition, Orders, etc.
- Live View: Get real-time insight into how many visitors are there at the moment, what visitors are doing right now, real-time page views, etc.
Open the Shopify Analytics, let’s dive deeper into the Overview dashboard and take a look at the most important metrics there:
SHOPIFY DASHBOARD
The Shopify Analytics Dashboard is designed for merchants and is easy to view, understand, and very effective. On the dashboard, you will find total sales, total sessions, total orders, conversion rate, sessions by traffic source, returning customer rate, sales by traffic source, and more.
If you’re confused and don’t know where you should start your store tour, as you might not have enough time to check everything at once, start looking at the Conversion Funnel.
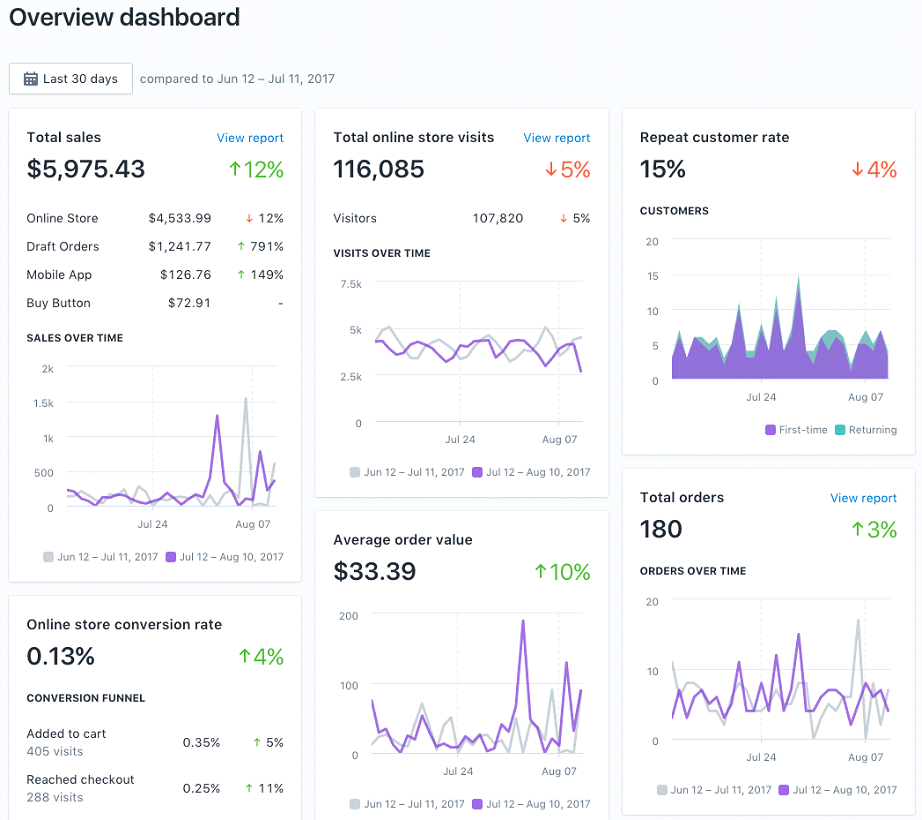
Source: FiverrBox
SHOPIFY REPORT
Different reports will be available based on the plan you have. All users have access to the finance reports and overview dashboard. Shopify standard reports don’t give you a competitive edge. If you’re on the Basic Shopify plan or higher, you also have access to other reporting categories, namely acquisition, behavior, and marketing.
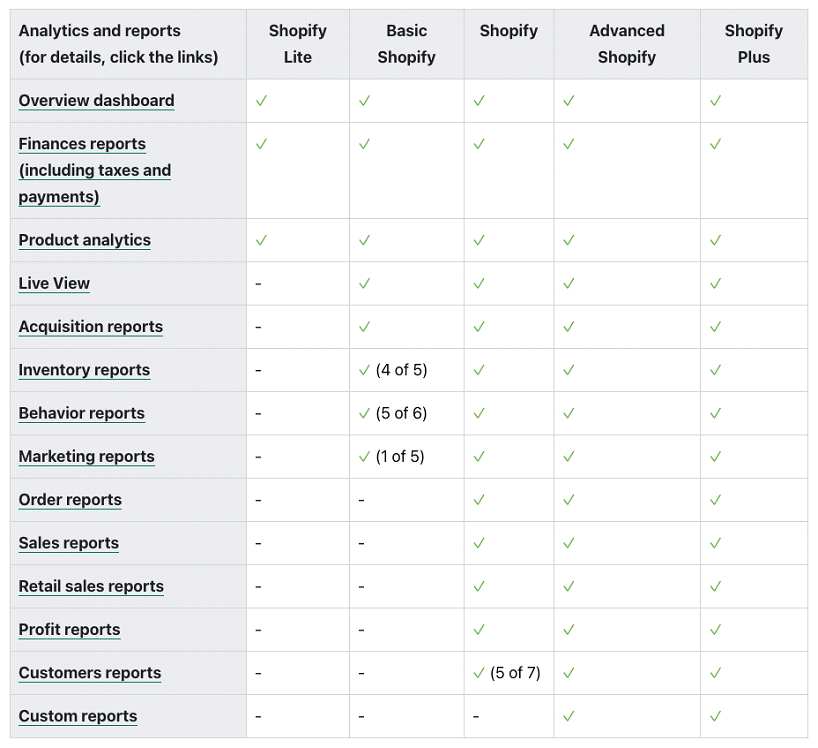
Source: Treslo
Shopify’s acquisition reports:
Get details about where your website visitors are coming from and measure the performance of your campaigns to increase visitor engagement.
This report will provide you below details:
- Sessions over time
- Sessions by referrer
- Sessions by location
- Sales
Shopify sales reports:
Make business decisions by comparing sales across channels, staff, products, and more.
This report will provide you below details:
- Sales over time
- Sales by product
- Orders
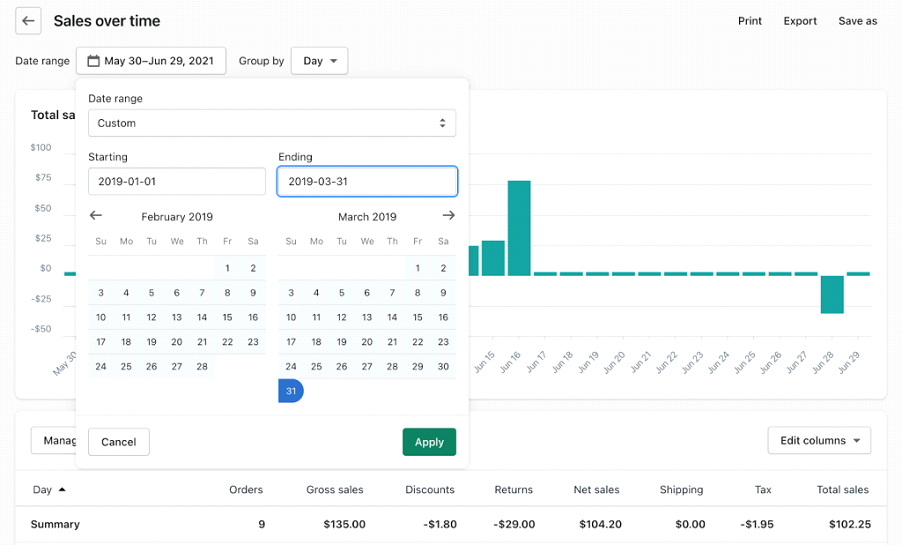
Source: Hevodata
Shopify order reports:
Analyze and get details on the store’s order volume like the number of orders placed, delivered, shipped, or returned, as well as focus on overall fulfillment performance, with orders reports.
This report will provide you below details:
- Orders over time
- Product orders and returns
- Fulfillment over time
- Fulfillment, shipping, and delivery times
- Profit margin
Shopify profit reports:
See how products and locations contribute to the gross profit and margin of your business.
This report will provide you below details:
- Profit by product
- Profit by product variant SKU
- Inventory
Shopify inventory reports:
For more efficient and better inventory management, you have to track and understand the movement of your products.
This report will provide you below details:
- Sell-through rate by product
- Days of inventory remaining
- ABC analysis by product
- Percent of inventory sold
- Average inventory sold per day
- Month-end inventory snapshot
- Month-end inventory value
- Behavior
Shopify behavior reports:
Understand how visitors move through your website to improve your store and website performance.
This report will provide you below details:
- Online store conversion over time
- Top online store searches
- Top online store searches with no results
- Product recommendation conversions over time
- Sessions by landing page
- Sessions by device
- Online store cart analysis
- Online store speed
- Customers
Gain customers’ insights to get a deeper understanding of who your customers are and how they communicate with your business.
This report will provide you below details:
- Customers over time
- First-time vs returning customer sales
- Customers by location
- Returning customers
- One-time customers
- Finances
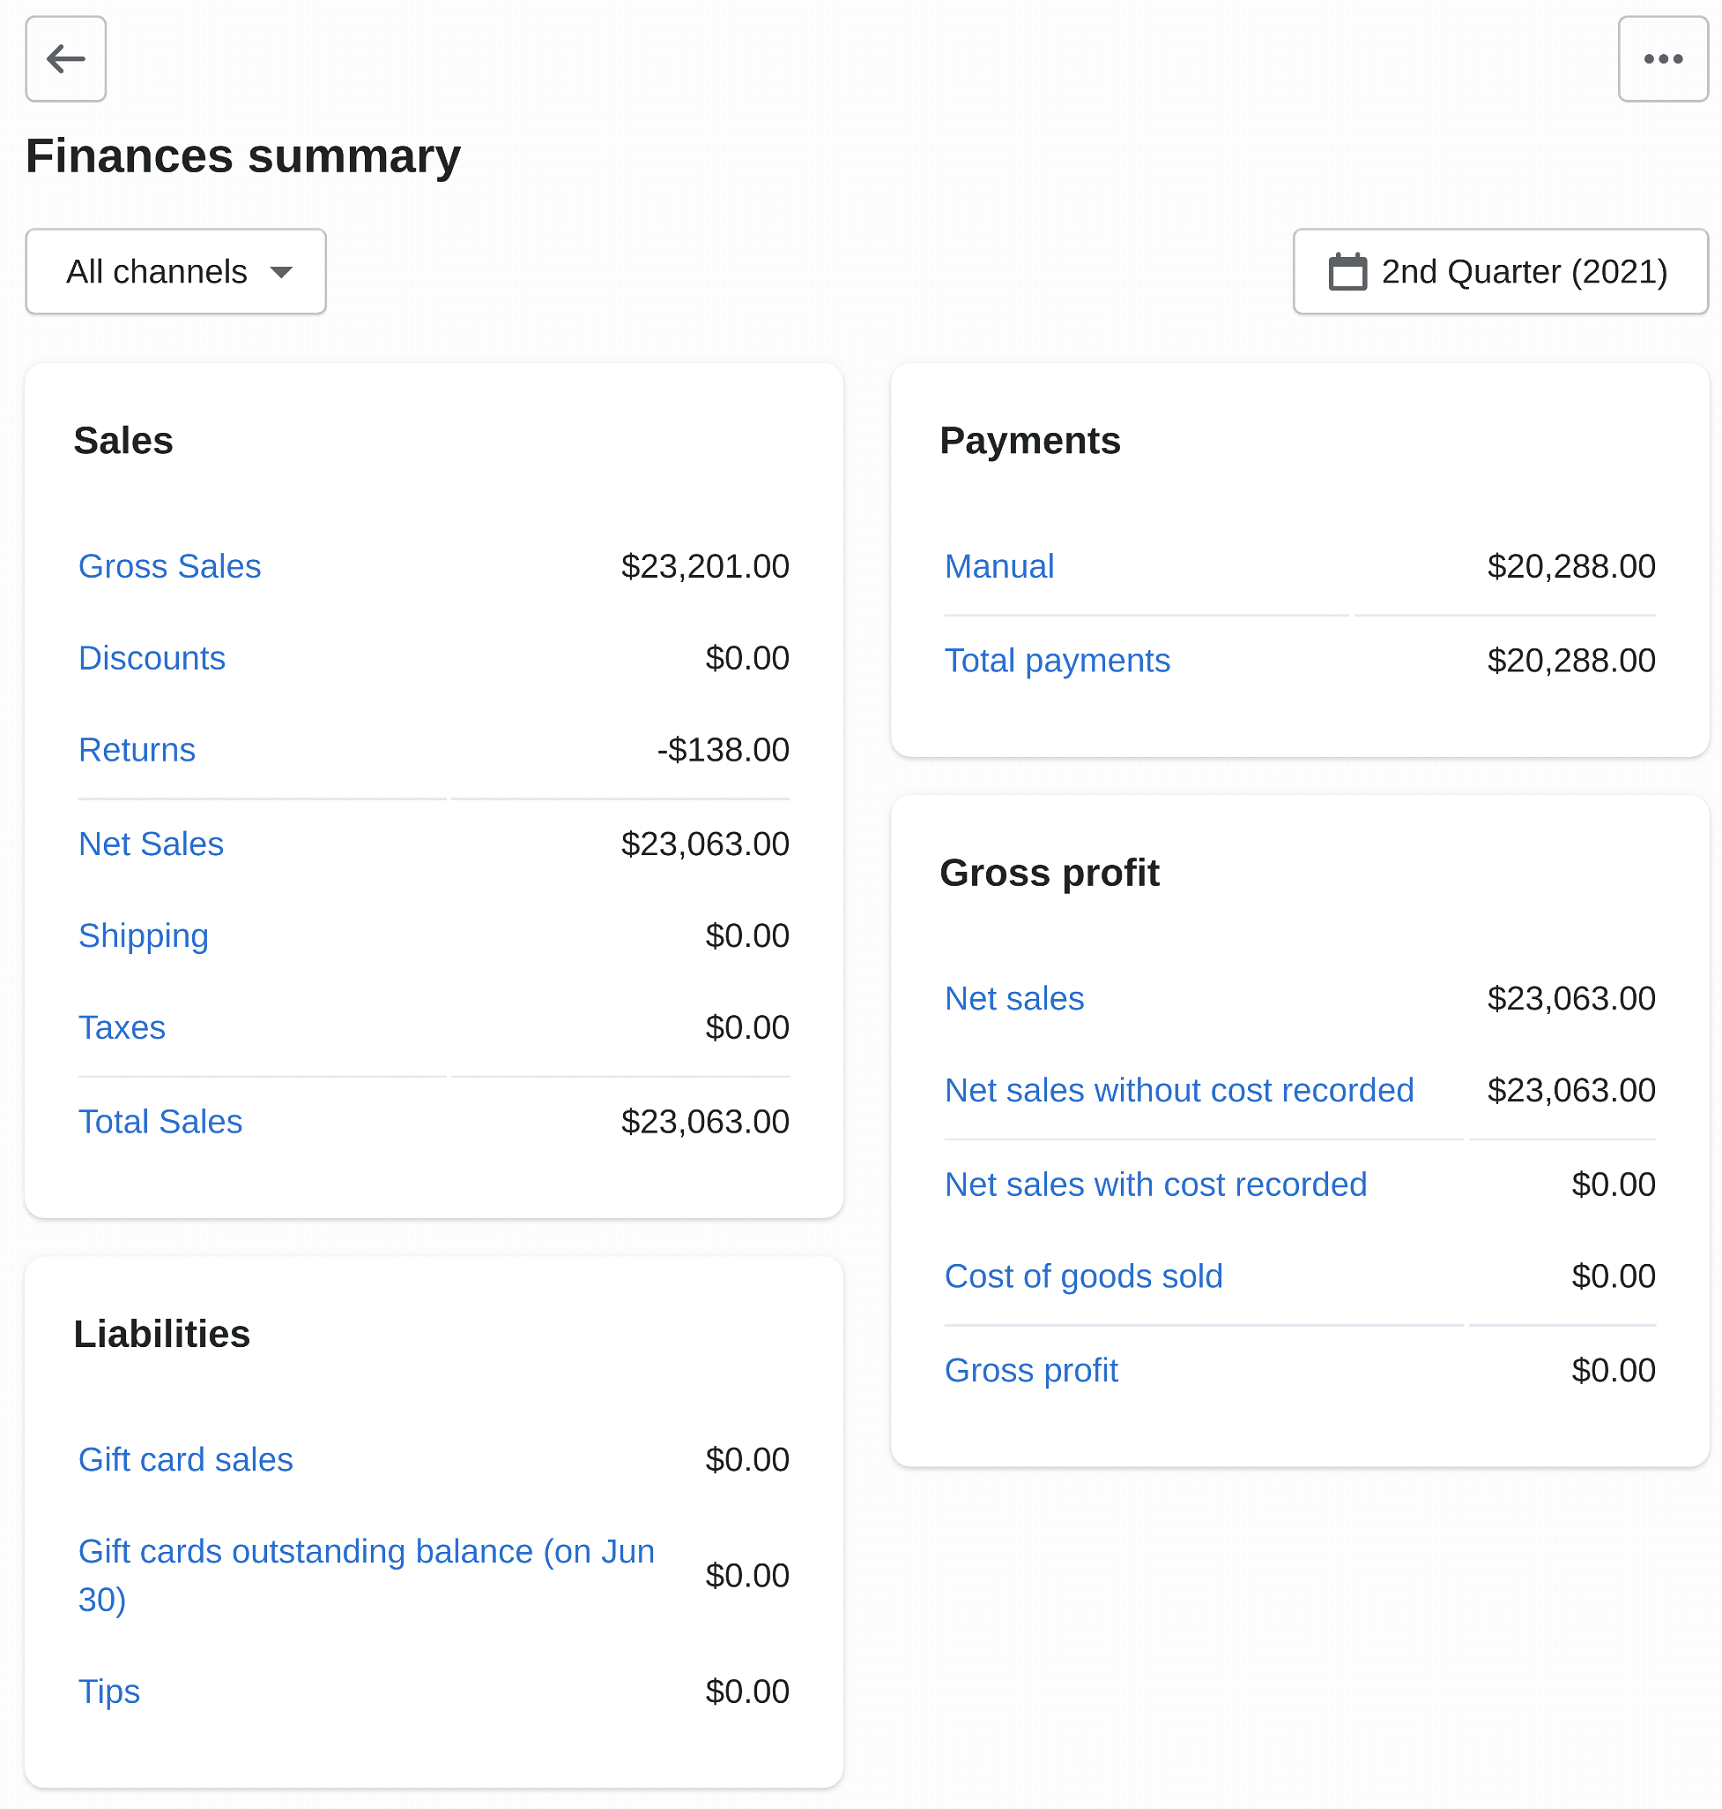
Shopify finance reports:
Check the store’s finances including sales, taxes, returns, payments, and more.
This report will provide you below details:
- Finances summary
- Total sales
- Taxes
- Tips
- Payments
- Marketing
Source: Omegacommerce
Shopify marketing reports:
Gain insights into where your online store customers are converting from.
This report will provide you below details:
- Sessions attributed to marketing
- Sales attributed to marketing
- Conversion by the first interaction
- Conversion by last interaction
- Attribution model comparison
SHOPIFY LIVE VIEW:
Shopify Analytics ‘Live View’ offers a real-time view of a world map showing you where your website visitors and orders are occurring at this exact moment. You will find out how many visitors viewing your store at the moment and from where they are coming from using the Live View section.
Access the ‘Live View’ in the admin dashboard for real-time activity analysis. View customers, items in carts, orders, new visitors, customers making purchases, and more in real-time. And you can view this from anywhere on any device. Using this data, you can make informed decisions about your marketing campaigns, inventory, and customer engagement.
Conclusion
So there you have it: everything you need to know about Shopify analytics and how you can use it for your business. By using the available data, you can make more intelligent decisions that will help your company to grow more, drive forward, and, ultimately, improve your bottom line.
Understating Shopify Analytics reports & data, will not only help you to optimize your eCommerce store , but will also help you make better decisions you need to take. This is the only way that can help you to determine what areas of your business are performing well and what areas require changes and improvements. Track it, measure it, and improve it. Need help? We have helped brands to build a Shopify store, feel free to Consult with our Shopify experts!